
📊 Full opportunity report: Stenvrik: News as Geography on ThorstenMeyerAI.com — validation score, market gap, and execution plan.
TL;DR
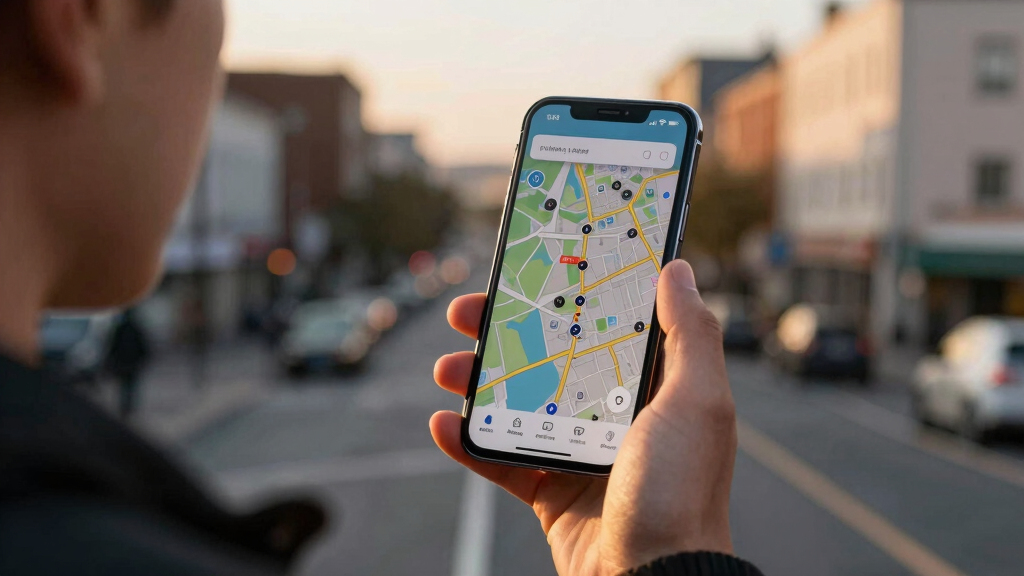
Stenvrik has launched a new news platform that visualizes live stories by geographic location using a 3D globe interface. Currently in closed beta, it aims to change how news is consumed and analyzed by emphasizing ‘where’ over ‘what.’
Stenvrik has launched a new news platform that visualizes live stories geographically, pinning approximately 1,700 stories across 49 city hubs on a rotating 3D globe. Currently in closed beta, this approach aims to reshape news consumption by emphasizing ‘where’ stories are happening, rather than just ‘what’ is new.
The platform organizes real-time news stories by geographic location, pinning them to 49 designated city hubs on a 3D globe interface. It features an autonomous trend engine that continuously surfaces, clusters, and pins stories without human intervention, enabling real-time updates across multiple regions. The project originated as a low-cost prototype from Claude Design’s ‘News Globe Demo’ and has been rebuilt for production at an estimated cost of roughly €0 per month, primarily due to client-side rendering and in-browser computation. The core innovation lies in its interface, which offers a spatial perspective on news, contrasting with traditional feeds that list stories chronologically. This geographic organization helps users identify clusters, gaps, and regional trends, providing contextual insight into how stories in different cities may influence global markets, politics, and supply chains. The underlying trend engine not only powers the front-end but also feeds signals into a broader network of content and market intelligence, making it a dual-purpose tool for both consumers and publishers. While the platform is still in closed beta and limited in availability, its low operational costs and autonomous data processing suggest it could serve as a scalable model for future news products that prioritize geographic context and real-time trend detection.Stenvrik — news as geography
Not what is the news — where is it happening. ~1,700 live stories pinned to 49 city hubs on a rotating globe, with an autonomous trend engine that also feeds the network.
Spin the world; the news sorts itself.
A 60fps 3D globe where every story is pinned to the city it belongs to. Clusters, gaps, regions heating up — context a vertical feed throws away.
Independent commentary, produced with AI assistance under human editorial oversight. The views are the author’s own and may change. Stenvrik is in closed beta; features, availability, and behavior may change and it is provided without guarantee of uptime or fitness for a particular purpose. The autonomous trend engine clusters and places stories programmatically and may contain errors, mis-placements, or omissions — verify independently before relying on any of it. Product and company names are trademarks of their respective owners; mention does not imply endorsement.
Implications of Geographical News Visualization
This development represents a shift in news consumption and analysis, emphasizing geographic context as a primary organizing principle. By visualizing stories on a globe, it enables users and news organizations to better understand regional trends, clusters, and emerging hotspots, which can influence market decisions, policy responses, and coverage priorities. The low-cost, autonomous trend engine also demonstrates a new approach to scalable, real-time news analysis that could reshape how media and data providers operate, especially when combined with broader market intelligence functions.

Replogle Illuminated World Globe with Stand, 12 Inch diamteter light up globe with 3-D Raised Relief Texture. Perfect for Children And Kid's Classroom and home Decor, Made In USA
Illuminated Blue Ocean Globe
As an affiliate, we earn on qualifying purchases.
As an affiliate, we earn on qualifying purchases.
Background and Development of the Geographical News Platform
Traditional news feeds have increasingly become a stream of headlines with little contextual organization, often overwhelming users with volume but lacking spatial or regional insights. Stenvrik’s approach emerged from a prototype by Claude Design, which visualized news on a globe with minimal operational costs. Recognizing the potential, developers rebuilt it into a production system, emphasizing autonomous trend detection and geographic clustering. This approach aligns with broader trends in data visualization and real-time analytics, aiming to provide more meaningful context for global events.
The platform’s focus on geography as an organizing principle is a departure from the dominant list-based feeds, aiming to answer the question: ‘Where is this happening?’ This aligns with the needs of market analysts, policymakers, and consumers seeking spatial awareness of ongoing developments.
“By organizing news on a globe, we give users a new way to see the world’s stories in context, highlighting regional trends and clusters that are often hidden in traditional feeds.”
— Thorsten Meyer, project lead

Qiaojoy Bilingual Interactive World Map for Kids Learning and Educational Toys, Talking Electronic Kids World Map i-Poster Geography Games Ages 3 to 12 Years Old, Custom Talking Birthday Gifts Card
【Bilingual World Map & DIY Magic Wand】- Educational talking world map great for children studying in both English…
As an affiliate, we earn on qualifying purchases.
As an affiliate, we earn on qualifying purchases.
Unclear Aspects of Platform Adoption and Impact
It is not yet clear how widely the platform will be adopted once in open access or how it will influence user behavior compared to traditional feeds. The long-term accuracy and usefulness of the autonomous trend engine in diverse news environments remain to be seen. Additionally, the platform’s ability to scale beyond the initial 49 city hubs and its integration with existing news ecosystems are still in development.

Vimy Underground
As an affiliate, we earn on qualifying purchases.
As an affiliate, we earn on qualifying purchases.
Next Steps for Platform Expansion and Integration
The platform is currently in closed beta, with plans to expand access gradually. Future developments include increasing the number of city hubs, refining the trend detection algorithms, and integrating with mainstream news outlets and data providers. Monitoring user engagement and feedback will determine its potential to influence news consumption and reporting practices. Further, the team aims to explore how geographic visualization can be combined with other contextual data to deepen insights.

Kaito Emergency Radio Voyager Max KA900 Digital Solar Dynamo Crank Wind Up AM/FM/SW & NOAA Weather Stereo Radio Receiver with Bluetooth, Real-time Alert, MP3 Player, Recorder & Phone Charger, Black
All-purpose 5-way powered portable emergency radio, hand crank generator, solar power, 5V USB input, 6V DC wall power…
As an affiliate, we earn on qualifying purchases.
As an affiliate, we earn on qualifying purchases.
Key Questions
How does the platform determine which stories to pin to each city hub?
The platform uses an autonomous trend engine that continuously surfaces, clusters, and ranks stories based on their geographic relevance, emerging trends, and clustering speed, without human input.
Can this system be integrated with existing news services?
Yes, the underlying trend engine is designed to be provider-agnostic and can feed signals into broader publishing networks or analytics platforms, potentially enhancing existing news ecosystems.
What are the main advantages of a geographic news visualization?
It offers spatial context, helps identify regional clusters and trends early, and provides a different perspective from traditional chronological feeds, aiding in faster understanding of global developments.
When will the platform be available to the public?
The platform is currently in closed beta; a public release date has not yet been announced.
What is the cost structure of the platform?
The system’s operational costs are minimal, estimated at roughly €0 per month, due to client-side rendering and autonomous trend processing running on owned hardware.
Source: ThorstenMeyerAI.com