
UPS runtime charts are simpler than they seem at first. They visually map battery capacity against load, making it easy to see how long your backup will last during outages. You can quickly assess if your UPS can handle your equipment needs and plan for battery replacements. Factors like power efficiency and environmental conditions also affect runtime, but these charts help you understand overall performance. Keep going to discover how understanding these details can guarantee your backup power remains reliable.
Key Takeaways
- UPS runtime charts visually map battery capacity against load, making it simple to estimate backup duration at a glance.
- Clear axes and labels help quickly interpret how long your UPS can power devices during outages.
- Understanding the impact of load and battery size allows for easier assessment of UPS suitability.
- Environmental and maintenance factors are often highlighted, simplifying troubleshooting and planning.
- These charts are designed to provide quick, intuitive insights without complex calculations.

Have you ever wondered how long a UPS can keep your critical devices running during a power outage? It’s a common concern, especially if you rely heavily on equipment like computers, servers, or medical devices. Fortunately, UPS runtime charts are designed to help you understand this, and surprisingly, they’re easier to interpret than you might think. These charts typically display how long your UPS can sustain a load, and they’re based on key factors like battery capacity and power efficiency.
Battery capacity plays a central role in determining runtime. The larger the battery’s capacity, the longer your devices stay powered during an outage. When you look at a runtime chart, you’ll see that it maps battery capacity against load. For example, a higher capacity battery can support a heavier load for a longer period. Conversely, if your devices draw significant power, the chart will show a reduced runtime, even with a sizable battery. This visual representation helps you gauge whether your UPS can handle your needs during emergencies, giving you confidence in your setup. Additionally, understanding how battery aging impacts capacity can help you plan for battery replacements and maintain reliable backup power over time. Regularly monitoring battery performance can also ensure your system remains dependable when it’s needed most. Moreover, considering environmental factors can influence the overall performance and longevity of your UPS.
Power efficiency is another essential factor illustrated in these charts. It reflects how effectively the UPS converts stored energy into usable power. A highly efficient UPS wastes less energy as heat, making the most of its battery capacity. When reviewing runtime charts, you might notice that some models offer longer runtimes at the same load because they operate more efficiently. This is especially important if you want to maximize your backup time without investing in a larger or more expensive battery. Power efficiency ensures that your devices stay protected longer, and understanding this aspect helps you select the right UPS for your specific needs. Recognizing how temperature effects influence runtime can also help optimize your UPS performance in different environments. Additionally, installing the UPS in a suitable environment can help maintain its efficiency and extend its lifespan.
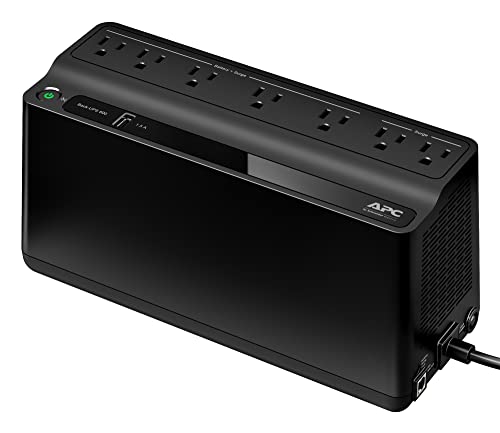
APC UPS Battery Backup for Power Outages, 600VA/330W Surge Protector, 7 Outlets, USB Charging, BE600M1 Uninterruptible Power Supply for Computers, Wi-Fi Routers, and Home Office Electronics
KEEP YOUR COMPUTER, WI-FI AND ROUTER RUNNING THROUGH POWER OUTAGES: Supplies short‑term battery power during outages to maintain…
As an affiliate, we earn on qualifying purchases.
As an affiliate, we earn on qualifying purchases.
Frequently Asked Questions
How Do Environmental Factors Affect UPS Runtime Accuracy?
Environmental impact, such as temperature fluctuations, can considerably affect your UPS runtime accuracy. Higher temperatures may cause the battery to degrade faster, reducing runtime, while cooler conditions help maintain battery health. Extreme environmental conditions can cause inaccurate runtime predictions on charts, leading to unexpected shutdowns. To guarantee accurate readings, keep your UPS in a stable environment, monitor temperature levels, and perform regular maintenance. This way, your UPS will perform at its best when you need it most.
Can UPS Runtime Charts Predict Future Performance Changes?
Yes, UPS runtime charts can help predict future performance changes, but they have limitations. Battery degradation over time can reduce runtime, and load variability affects accuracy. By regularly updating these charts with current data, you can spot trends and anticipate how your UPS might perform later. However, keep in mind that unforeseen environmental factors or significant load changes can still impact actual runtime, so stay vigilant.
Are There Industry Standards for UPS Runtime Chart Formatting?
Yes, industry standards for UPS runtime chart formatting exist, helping you compare performance accurately. These standards account for factors like battery degradation and load variability, ensuring the charts reflect real-world conditions. By following these guidelines, you can better understand how your UPS might perform over time and under different loads. Consistent formatting makes it easier to identify when maintenance is needed, ensuring your system remains reliable and efficient.
How Often Should UPS Runtime Charts Be Updated?
You should update UPS runtime charts at least annually, especially if your battery lifespan approaches its limit or if you experience frequent power fluctuations. Regular updates guarantee the chart accurately reflects current performance, helping you plan for replacements and maintain reliable backup power. Updating more often, like every six months, is wise if your environment faces unstable power or if you notice battery degradation, ensuring your system stays protected.
Do Different UPS Brands Use Comparable Chart Scales?
Brand comparison brings clarity, but chart consistency can vary widely. Different UPS brands often use distinct scales, making comparisons tricky. You’ll want to look closely at each chart’s axes and units to understand their specific scales. While some brands aim for comparable chart scales to ease evaluation, others prioritize different metrics. So, always check the details carefully to make accurate comparisons, ensuring you choose the best UPS for your needs.
UPS runtime chart
As an affiliate, we earn on qualifying purchases.
As an affiliate, we earn on qualifying purchases.
Conclusion
You might be surprised how straightforward UPS runtime charts are once you get the hang of them. They reveal essential details about how long your power backup can keep your devices running during an outage. Did you know that a typical UPS can provide backup for up to 30 minutes, enough time to save your work and shut down safely? With these charts, you’ll feel more confident in choosing the right UPS for your needs, making power management simpler than ever.
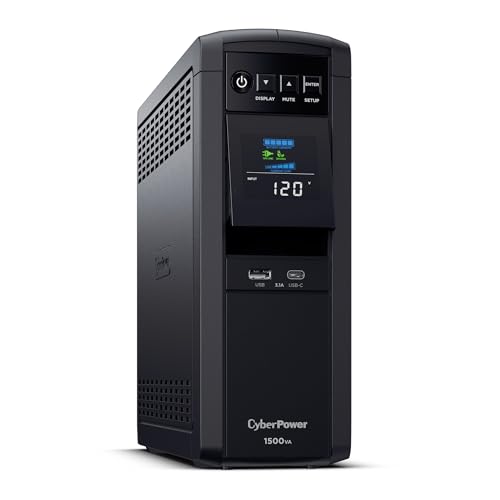
CyberPower CP1500PFCLCD PFC Sinewave UPS Battery Backup and Surge Protector, 1500VA/1000W, 12 Outlets, AVR, Mini Tower, UL Certified
1500VA/1000W PFC Sine Wave Battery Backup Uninterruptible Power Supply (UPS) System designed to support active PFC and conventional…
As an affiliate, we earn on qualifying purchases.
As an affiliate, we earn on qualifying purchases.

APC UPS Back-UPS Pro 1500VA UPS, 900W Battery Backup & Surge Protector, AVR, 10 Outlets (NEMA 5-15R), LCD, BX1500M Uninterruptible Power Supply for Computers, Wi-Fi Routers, Home Office Electronics
1500VA / 900W RELIABLE BACKUP POWER: The highest VA capacity available for home use; delivers short‑term battery power…
As an affiliate, we earn on qualifying purchases.
As an affiliate, we earn on qualifying purchases.