To create a personal dashboard for 2025, start by centralizing your key goals across areas like health, career, and finances. Use data visualization tools like charts and graphs to track progress and identify trends easily. Connect your favorite apps to automate updates and keep everything current. Focus on designing an intuitive layout that motivates you and reflects your priorities. If you continue, you’ll discover how to tailor your dashboard for maximum impact and success.
Key Takeaways
- Define your core goals across health, career, finances, and personal growth to guide dashboard focus.
- Select and integrate relevant tools (fitness apps, financial trackers, project management) for automated data updates.
- Design visualizations like charts and gauges to track progress and identify trends at a glance.
- Customize layout, colors, and metrics to create an intuitive, motivating, and personalized dashboard experience.
- Regularly review and update data to stay aligned with evolving goals and maintain motivation throughout 2025.

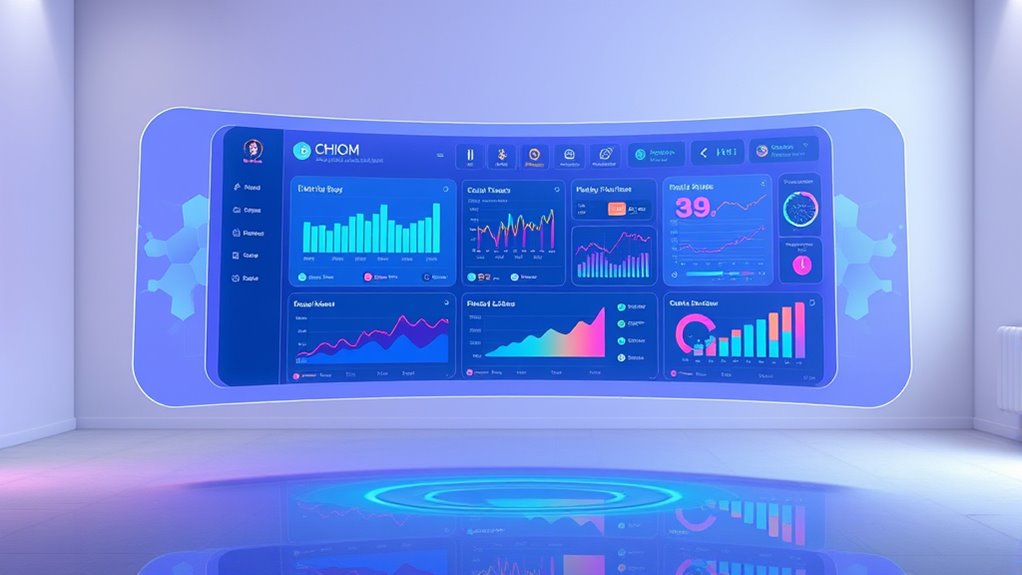
Have you ever wondered how to stay organized and focused in a rapidly evolving world? Building a personal dashboard for 2025 is an excellent way to do just that. At its core, a dashboard acts as a centralized hub that consolidates your most important data, giving you a clear picture of your progress and priorities. To make it truly effective, you should leverage data visualization techniques that turn raw numbers into intuitive visuals—charts, graphs, and gauges that make information instantly understandable. Instead of sifting through endless spreadsheets or scattered notes, you’ll see your goals and metrics displayed in a way that’s easy to interpret at a glance. This approach not only saves time but also helps you spot trends and identify areas needing attention faster.
A personal dashboard simplifies your data, helping you stay focused and achieve goals efficiently in a changing world.
When it comes to goal tracking, your dashboard becomes your personal command center. You can set specific targets for different areas of your life—whether it’s health, career, finances, or personal development—and monitor them regularly. By embedding goal tracking into your dashboard, you get real-time updates on your progress. For example, a simple bar chart could show your monthly steps or workout sessions, while a line graph tracks your savings growth over time. Seeing these visual cues motivates you to stay consistent and adjust your strategies when necessary. The key is to keep your goal tracking data current and relevant, making it a living tool that evolves with your journey. This way, you remain accountable and motivated, recognizing achievements and addressing setbacks promptly. Additionally, understanding data visualization techniques can help you design more effective and engaging visuals that truly resonate with you.
Creating a personal dashboard also means choosing the right tools and data sources. You might integrate fitness apps, financial accounts, or project management platforms to automatically pull in your data. This automation ensures your dashboard stays up-to-date without requiring manual input every day. Additionally, customize your visuals to match your preferences—use colors that inspire you or layouts that make information easy to scan. The ultimate goal is to design a dashboard that feels intuitive, inspiring, and tailored to your unique objectives. When you have everything visualized in one place, it becomes easier to prioritize tasks, allocate your time efficiently, and stay aligned with your long-term vision.
In essence, a well-designed personal dashboard is your secret weapon for thriving in 2025. By combining smart data visualization with effective goal tracking, you gain clarity and control over your life’s direction. It transforms chaos into order, allowing you to focus on what truly matters and celebrate your progress along the way. This proactive approach keeps you motivated and adaptable in a world that’s constantly changing, empowering you to reach your full potential.
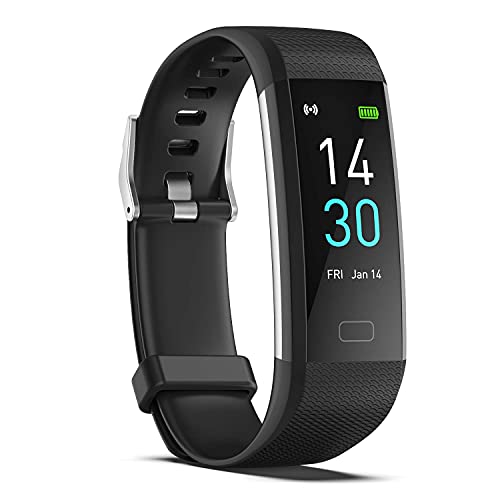
Fitness Tracker with Step/Distance/Calories Counter, Activity Tracker with Heart Rate Monitor, Slim Style Watch IP68 Waterproof, Sleep Monitor Tracker, Pedometer Watch for Women Men
【All-day Activity Tracker】: ENGERWALL IP68 Waterproof fitness tracker can record and track your daily steps, calories burned, exercise…
As an affiliate, we earn on qualifying purchases.
As an affiliate, we earn on qualifying purchases.
Frequently Asked Questions
What Skills Are Essential to Develop for Dashboard Customization?
You need strong skills in data visualization to make your dashboard clear and engaging, helping users quickly grasp information. Focus on improving your user experience design skills to create intuitive, user-friendly interfaces. Learning how to customize dashboards with tools like Tableau or Power BI also enhances your ability to tailor data displays to your needs. Combining these skills guarantees your dashboard is both visually appealing and easy to navigate.
How Can I Ensure My Data Privacy and Security?
You can’t put all your eggs in one basket when it comes to data privacy and security. Use data encryption to protect sensitive information and implement strict access control to limit who sees what. Regularly update your security measures, stay aware of potential threats, and back up your data. This way, you keep your personal dashboard secure, ensuring your data remains private and safe from breaches.
What Are the Best Tools for Creating an Interactive Dashboard?
You should consider tools like Tableau, Power BI, and Google Data Studio for creating an interactive dashboard. These platforms excel in data visualization and offer user interface design features that make your dashboard intuitive and engaging. They allow you to connect various data sources, customize visuals, and add interactive elements, ensuring your dashboard is both functional and visually appealing. Choose one based on your specific data and design needs.
How Often Should I Update My Dashboard for Accuracy?
You should update your dashboard regularly—ideally weekly or bi-weekly—to guarantee data visualization remains accurate and current. Frequent updates help you spot trends and make informed decisions quickly. Focus on refining the user interface design to keep it intuitive, and make sure your data sources stay synchronized. Consistent updates maintain the integrity of your insights, making your dashboard a reliable tool for tracking progress and achieving your goals effectively.
Can I Integrate AI Features Into My Personal Dashboard?
Yes, you can integrate AI automation into your personal dashboard to enhance functionality, like predictive analytics or personalized insights. Just guarantee your data encryption measures are robust to protect sensitive information. AI features can automate routine tasks and provide smarter recommendations, but always verify that your integrations follow security best practices to keep your data safe and private. Regular updates will help maintain peak performance and security.

Executive Financial Performance Dashboards: Track · Analyze · Decide (Executive Project Governance Series)
As an affiliate, we earn on qualifying purchases.
As an affiliate, we earn on qualifying purchases.
Conclusion
Think of your personal dashboard as the cockpit of your life’s airplane. It keeps all your essential stats in sight, guiding you smoothly through 2025. With clear visuals and real-time updates, you can navigate challenges and celebrate wins like a seasoned pilot. Remember, this dashboard isn’t just a tool—it’s your co-pilot, helping you stay on course and reach your destination with confidence. Take control, and enjoy the journey ahead!
The Behavior Shift Goal Shift Planner – Undated Goal Setting tool & Life Planner – Productivity journal & Workbook with Checklist – 7 Week Self Improvement & Weekly Progress Tracker
FROM GOAL SETTING TO GOAL GETTING: Designed for flexibility, this 7 Week undated Goal Shift Planner lets you…
As an affiliate, we earn on qualifying purchases.
As an affiliate, we earn on qualifying purchases.

Goal Planning Notepad – A5 Goal Setting Journal For Project Action Plan,Task Management, Personal Development & Track Goals. Productivity Notepad For Daily Work & School – 54 Sheets
GOAL PLANNING NOTEPAD – The Goal setting notebook features a highly effective template that will help you to…
As an affiliate, we earn on qualifying purchases.
As an affiliate, we earn on qualifying purchases.